From the all the analysis above, we can draw conclusions on each part.
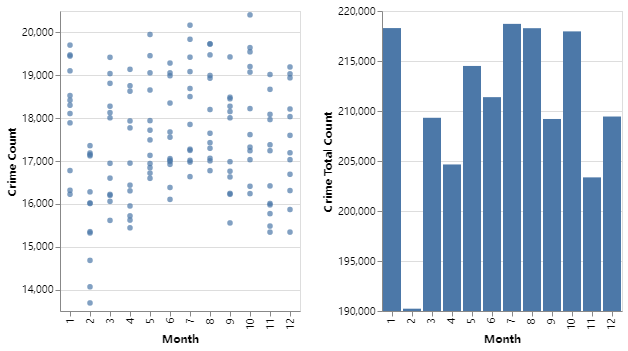
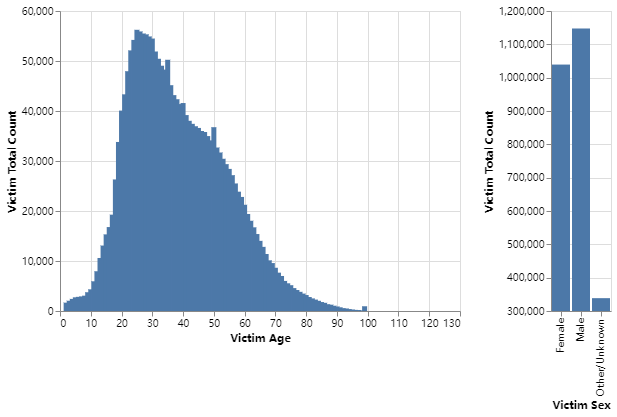
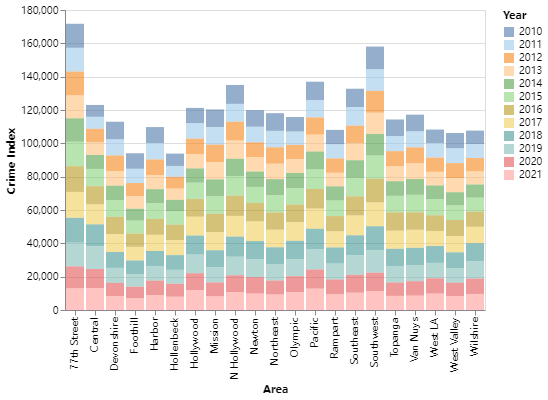
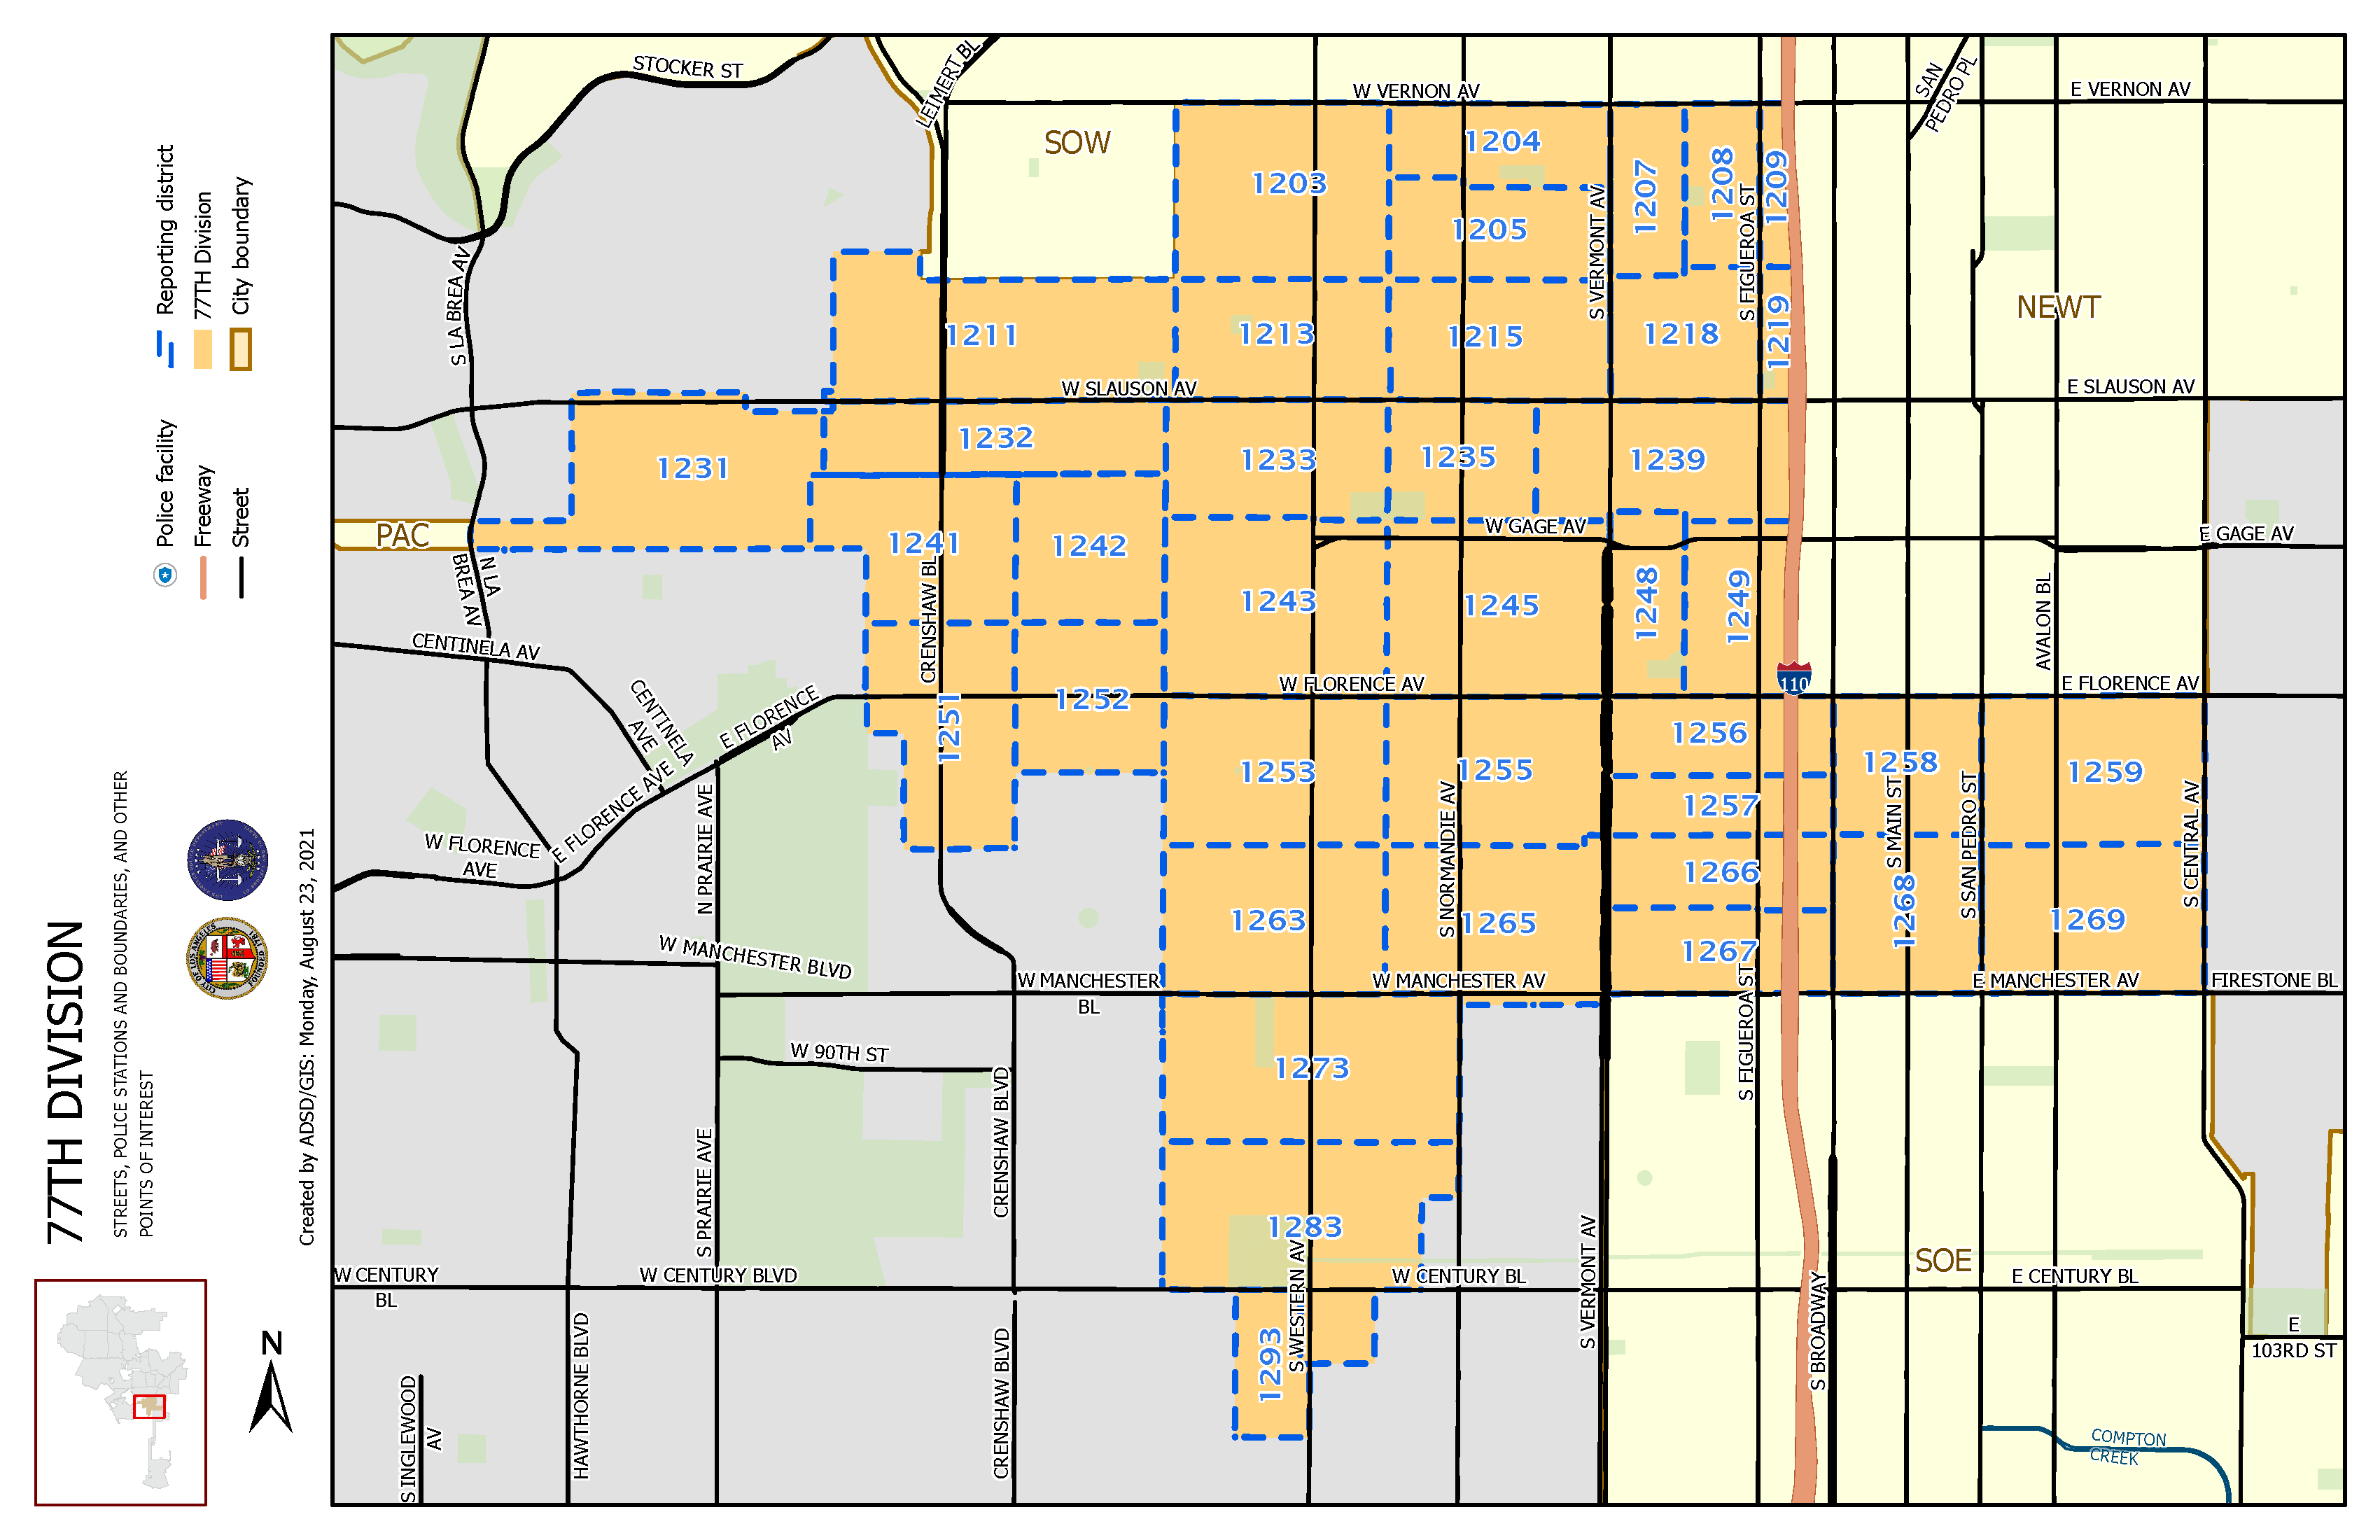
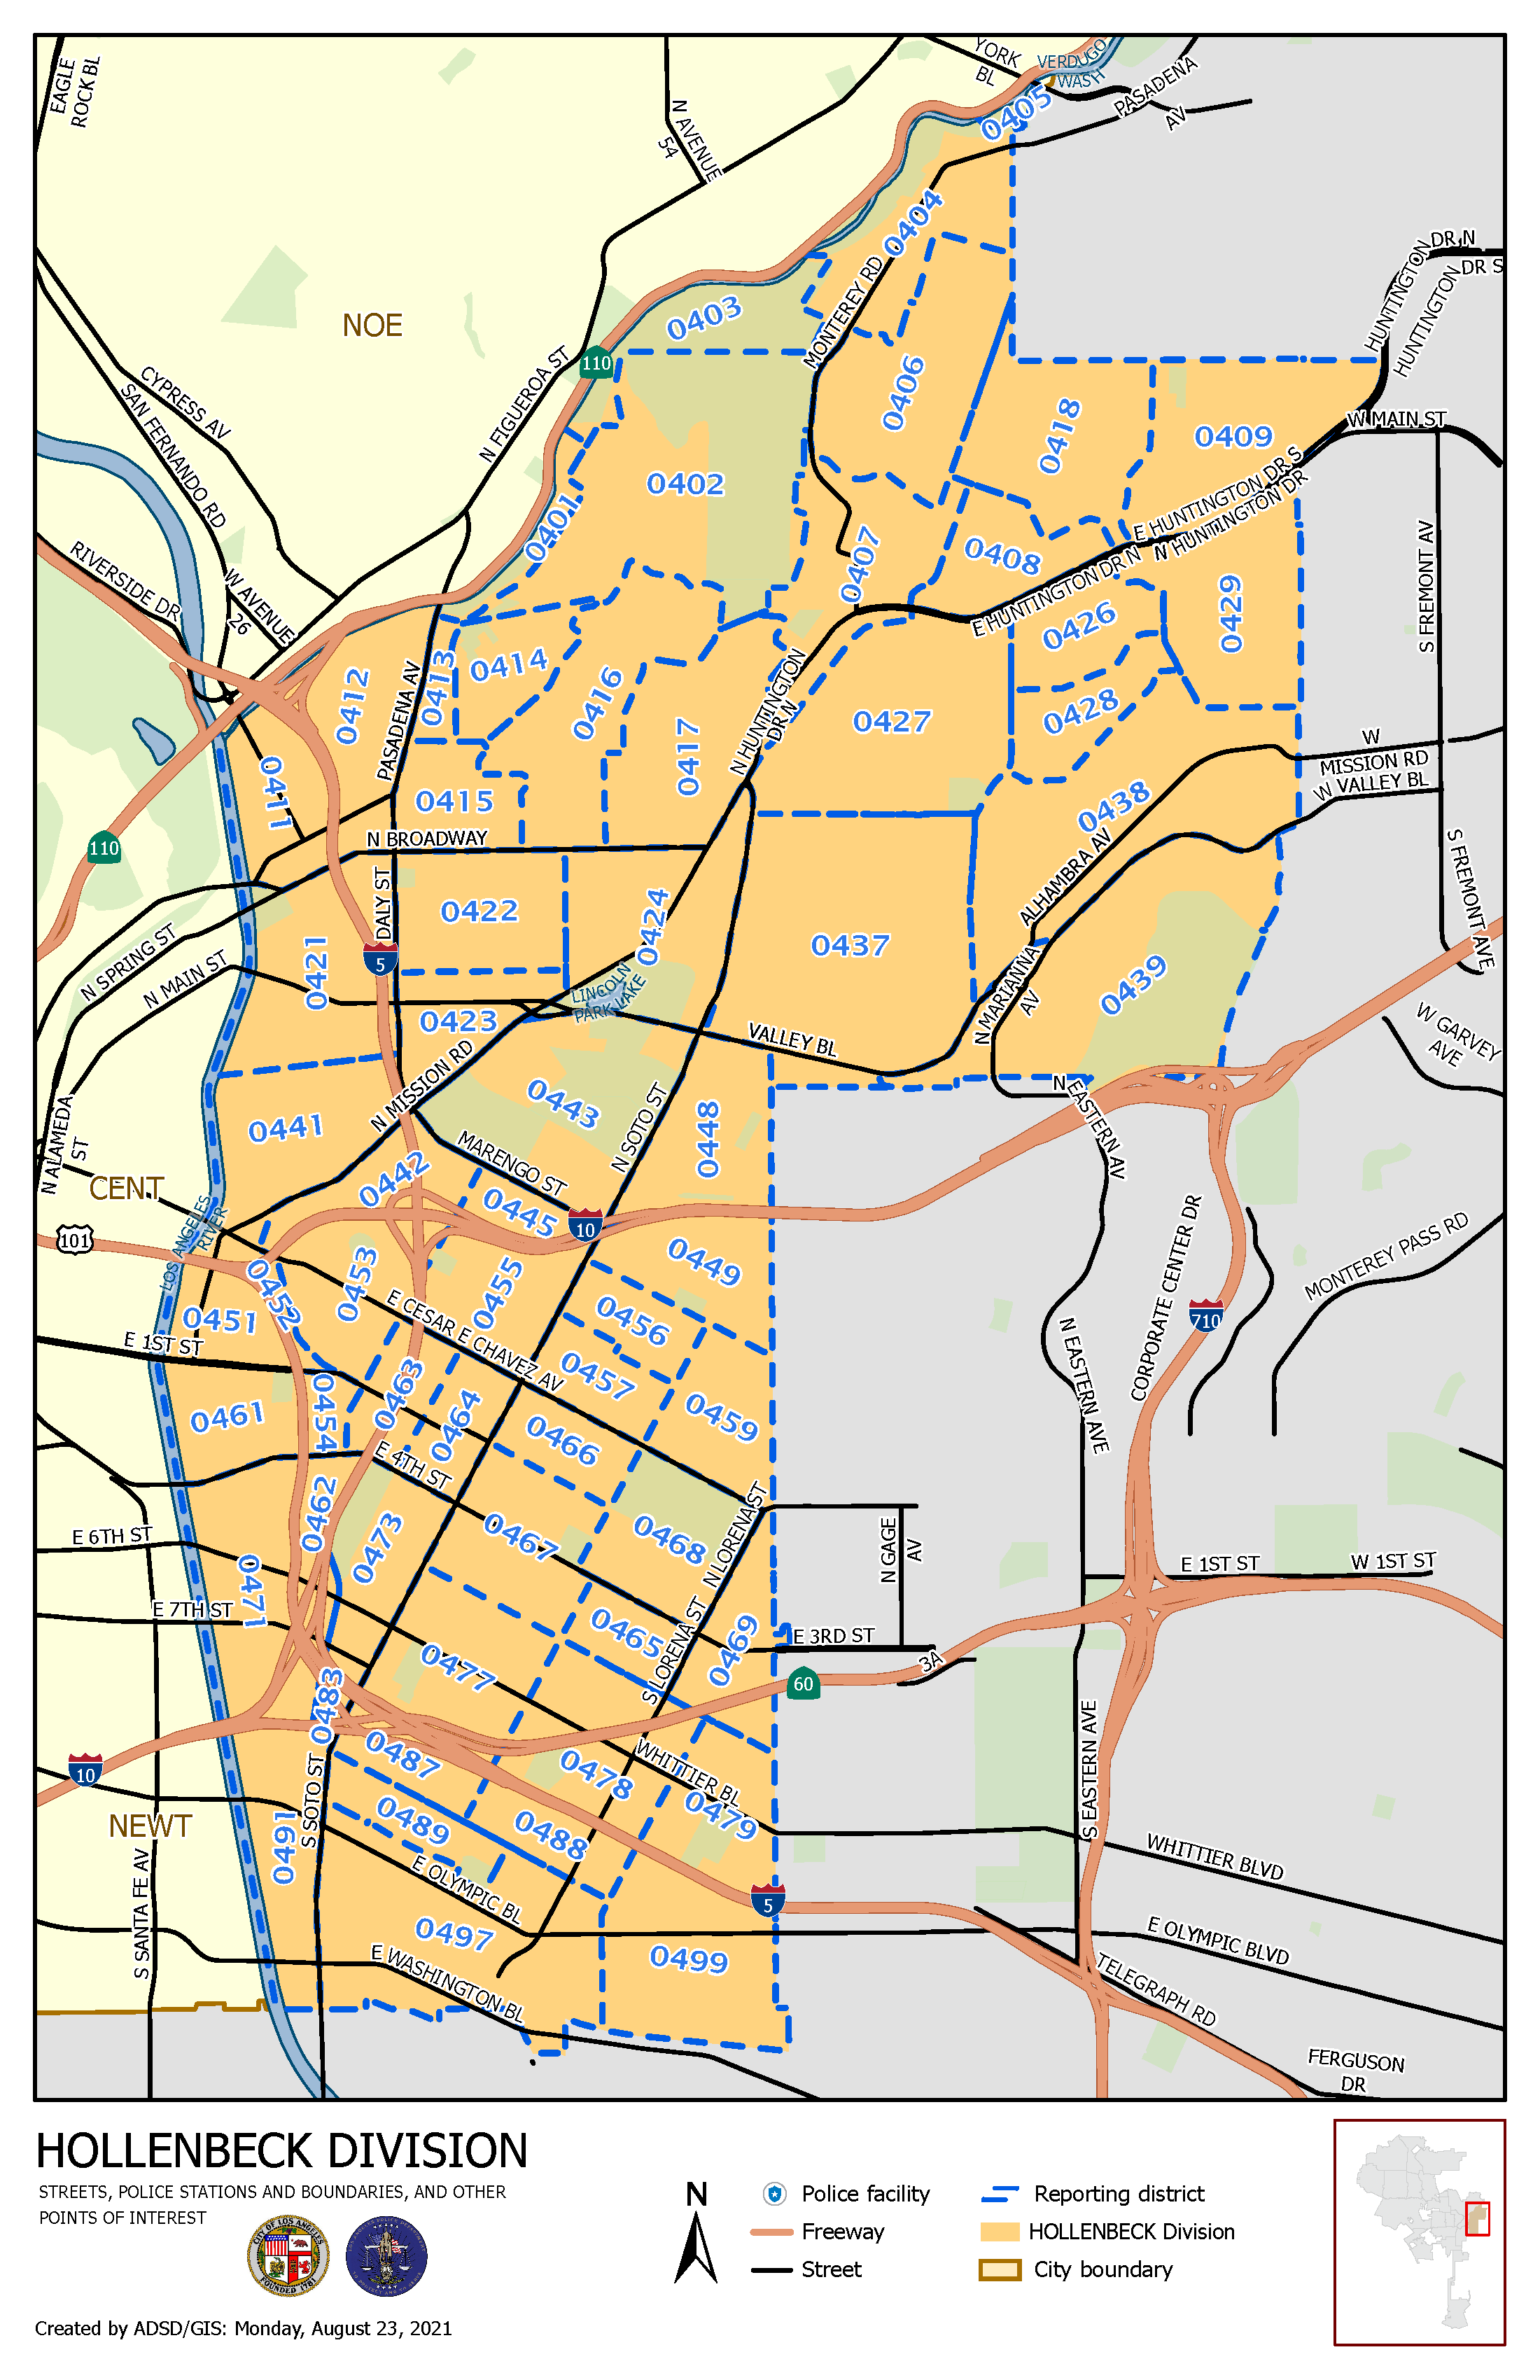
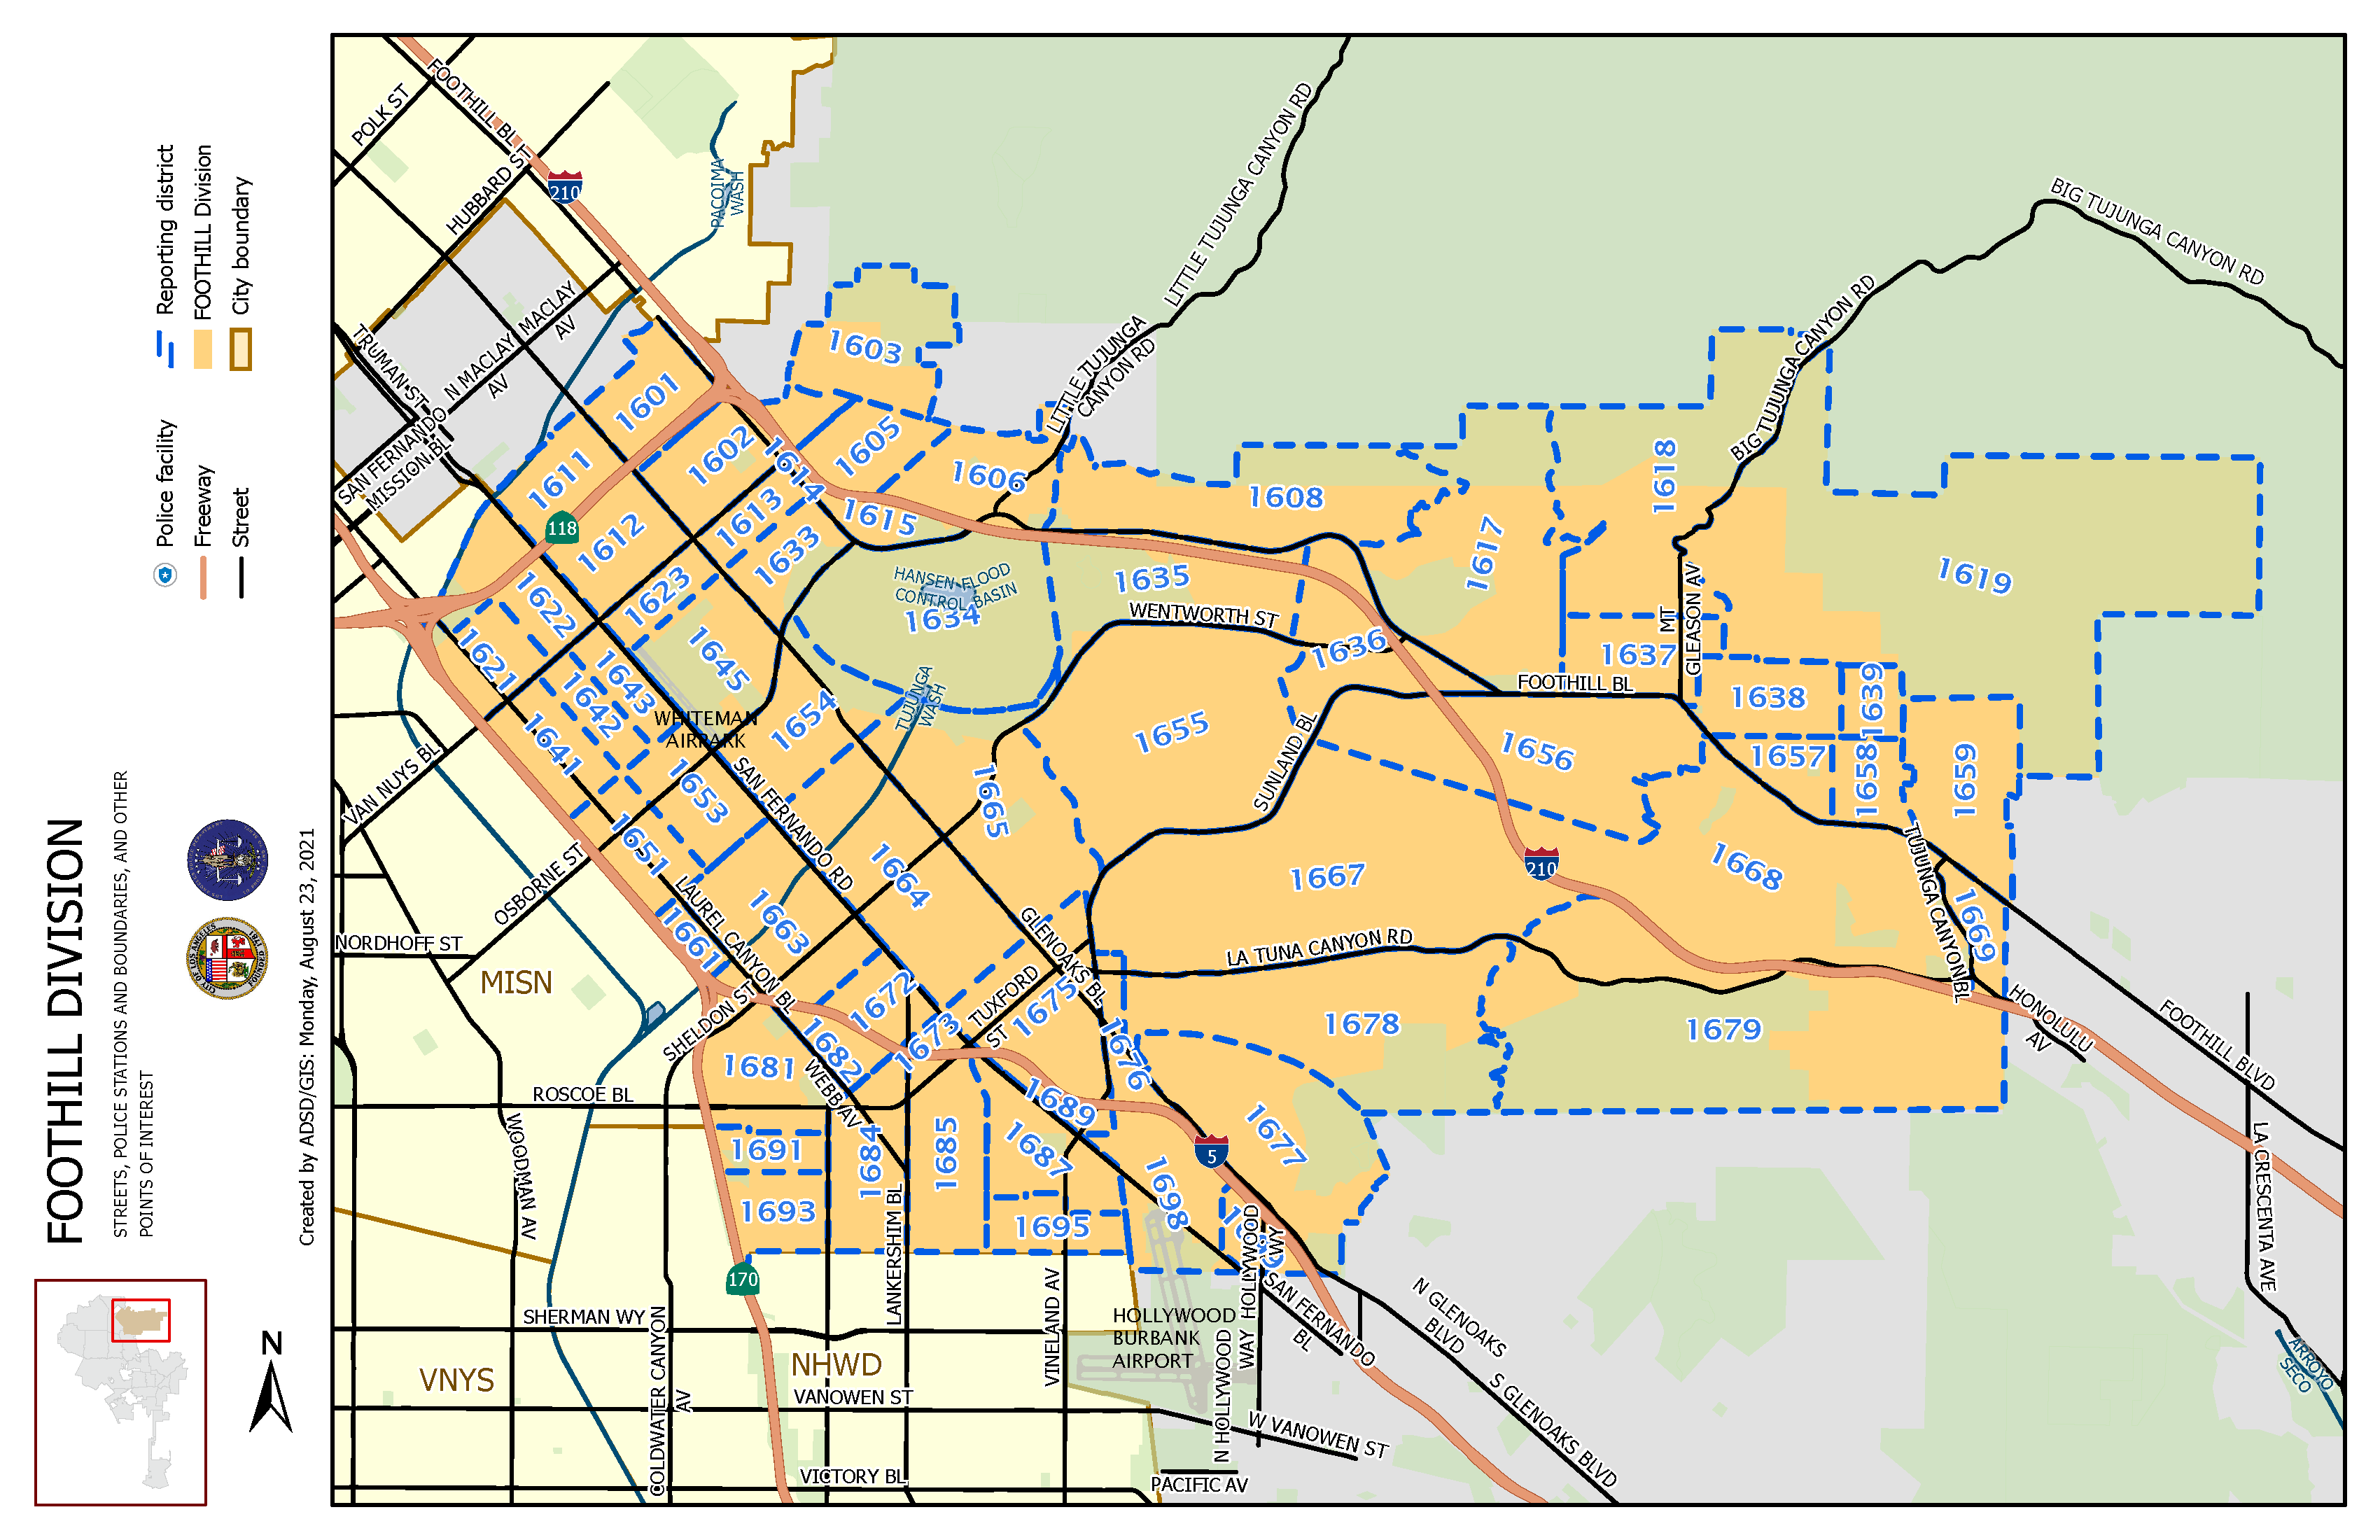
From visualization part, we can observed that Janurary, July, Augest and October are the most concentrated Months with crimes happening. Also, age 20 to 30 are the most population being victimlized. Moreover, male victims are more than female victims. At last, with visual analysis on dangerous index, we derived that 77th Street Area is considered most dangerous area, on the other hand, Hollenbeck and Foothill area are considered safest area in the City of Los Angeles.
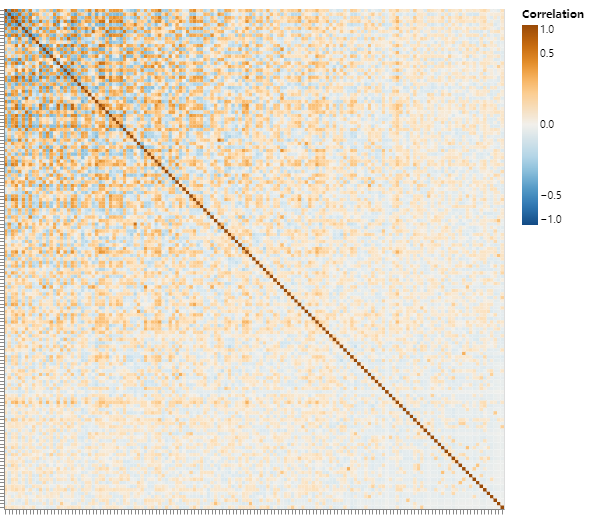
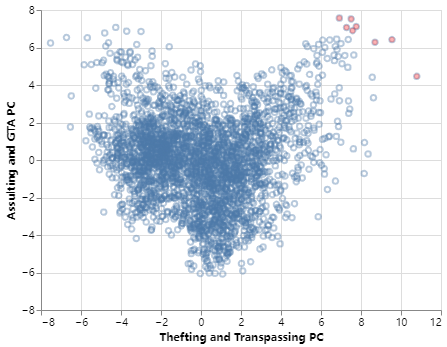
From PCA analysis part, by using PCA from sklearn package, four major bigger categories of crimes are discovered. The four major bigger categories are firearm related category, thefting and transpassing category, assulting and GTA category, and other than theft and burglary category. Also, analysis has pointed out that Central area in 2019 different from the other area tend to have more Assulting, GTA, Thefting and Transpassing than the other time in other area of the City of Los Angeles.
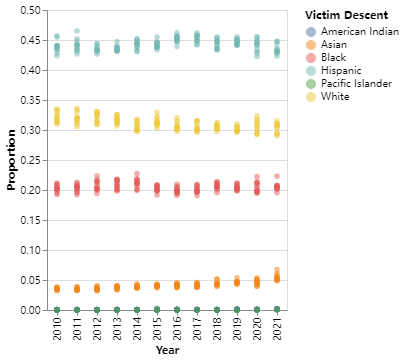
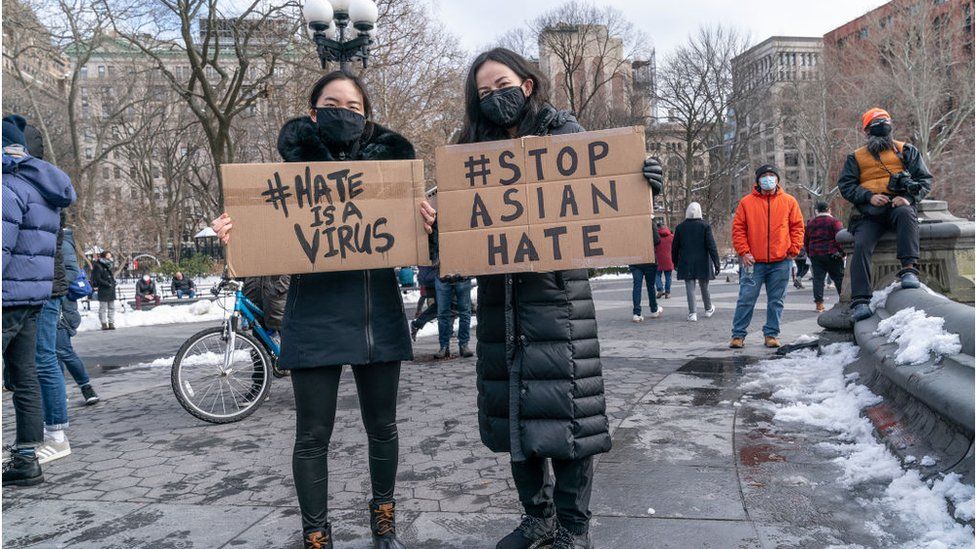
From Loess polt analysis part, by plotting the loess plot of victim count by descent, we found a potential increase on proportion of Asian descent. Connect to the new about COVID-19 related Asian Hate, the findings also make sense to the reality.
For future, since significant bouncing pattern on victim descent scatter plot observed after COVID-19 transmitted to the City of Los Angeles. Will the scatters still keep this pattern for post-COVID time, or will the pattern get back to normal? This question will be very thought-provoking for future analysis on crime data.


